Guni provides you dashboard based on message history, so that you can analyze your spending, messages sent and received on weekly and monthly basis.
How is Dashboard Useful to me ?
- You can view data in graphical form.
- It displays total spending, messages sent and received with optouts on weekly/monthly basis.
- You can use it to compare previous week/month data to the current one.
- Make it easy to keep a track of things.
Dashboard Analysis
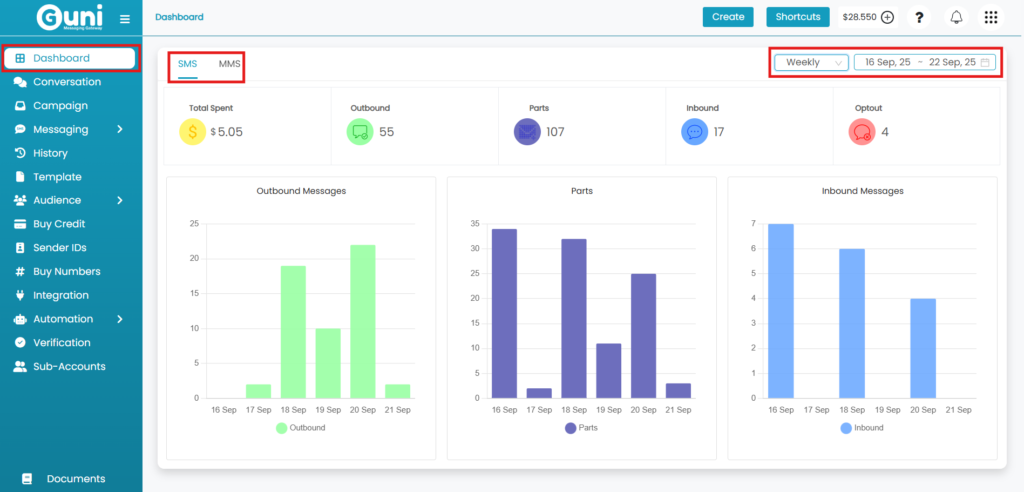
- Dashboard will be opened by default after login in. Click on ‘Dashboard‘ from left-hand menu to view it from any other page.
- Select SMS/MMS tab as requirement
- SMS – For SMS analytics.
- MMS – For MMS analytics.
- Select Timespan
- Weekly – For Week wise data analytics.
- Monthly – For Month wise data analytics.
- Fill Date Filter
- Select one week duration for weekly, data of each day will be displayed.
- Select 6 months duration for monthly, data will be displayed monthly.
- Information on Dashboard – (for selected time frame)
- Outbound- No. of receivers of messages (will provide data from 17 sept 2025 onwards)
- Parts – No. of messages sent
- Inbound – No. of received messages
- Total spent – Amount spent on Message sending
- Optout – No. of blocked messages.
Dashboard displays analytics till one day prior. So, today’s data will be displayed tomorrow.
Check out – Campaign Report.